First Quarter 2018 Home Price index - Updated 30 Apr 2018
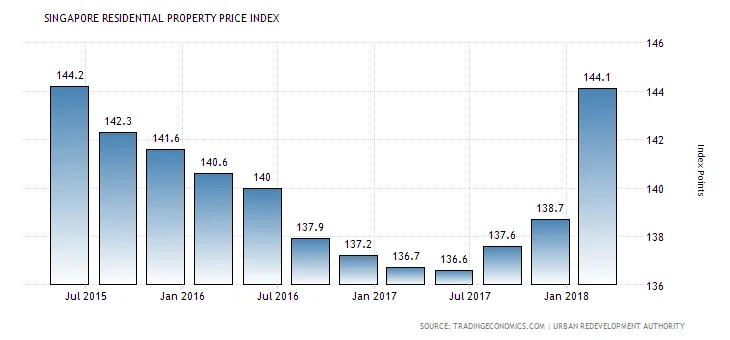
Property price index in Singapore jumped 3.9 percent quarter-on-quarter to 144.1 in the March quarter of 2018, compared to a preliminary figure of a 3.1 percent increase and following a 0.8 percent gain in December quarter 2017, final figure showed. It was the biggest quarterly gain since the second quarter of 2010, as prices rose faster for both landed (1.9 percent vs 0.5 percent in Q4) and non-landed properties (4.4 percent from 0.8 percent in Q4). Among regions, prices of non-landed private residential properties increased by 5.5 percent in Core Central Region (vs 1.4 percent in Q4); by 1.2 percent in the Rest of Central Region (vs 0.4 percent in Q4); and by 5.6 percent in Outside Central Region (vs 0.8 percent in Q4). Housing Index in Singapore averaged 76.30 Index Points from 1975 until 2017, reaching an all time high of 154.60 Index Points in the third quarter of 2013 and a record low of 8.90 Index Points in the first quarter of 1975.
Source: tradingeconomics.com
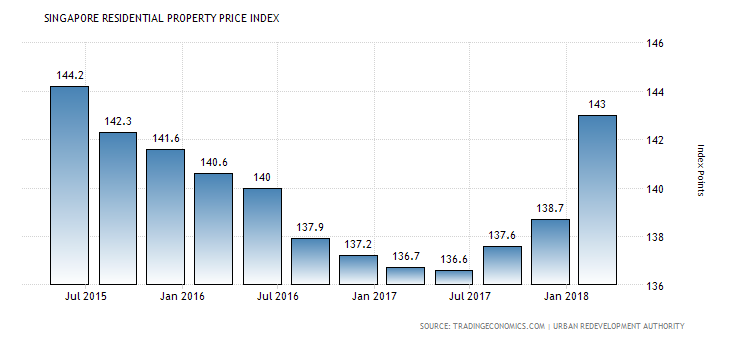
Singapore’s private home prices surged 3.1 percent quarter-on-quarter in the three months to March 2018, after a 0.8 percent rise in the previous period, a preliminary estimate showed. It was the biggest quarterly gain since the second quarter of 2010, as prices rose faster for both landed (1.8 percent vs 0.5 percent in Q4) and non-landed properties (3.4 percent from 0.8 percent in Q4). Among regions, prices of non-landed private residential properties increased by 5 percent in Core Central Region (vs 1.4 percent in Q4); by 1.1 percent in the Rest of Central Region (vs 0.4 percent in Q4); and by 3.8 percent in Outside Central Region (vs 0.8 percent in Q4). Housing Index in Singapore averaged 76.30 Index Points from 1975 until 2017, reaching an all time high of 154.60 Index Points in the third quarter of 2013 and a record low of 8.90 Index Points in the first quarter of 1975.
Source: tradingeconomics.com